Troubleshooting
Trying to find out what went wrong with web applications can be tricky. Here are a few pointers.
Using the Google Cloud Debugger
- Google's setup instructions for Cloud Debugger for Python.
- Instructions for using the Google Cloud Debugger on Python and other languages
- Questions tagged Google Cloud Debugger on stackoverflow.
Error message: "Admin is disabled because insecure channel"
If your app is running on GAE and you click the "My Sites" link in the web2py welcome app (it also appears by default on all apps created using the wizard) and you get the message "Admin is disabled because insecure channel" try the URL with https in front instead of http.
You'll be asked for your Gmail login credentials.
Adding web2py logging to gaehandler.py
Sometimes the only way to find out why something's going wrong is to enable logging in gaehandler.py.
Remember how deployment requires this step:
# Change to your web2py base directory
cd web2py

# Copy the example gaehandler.py
# file to the web2py directory
cp handlers/gaehandler.py .
- Open that copy of gaehandler.py for editing and change this line:
LOG_STATS = False # web2py level log statistics
to:
LOG_STATS = True # web2py level log statistics
Viewing web2py's httpserver.log
There's a file in root web2py directory called httpserver.log. Its format is the same as many common web server logs with these columns:
- IP address of requester
- Date/time of request
- GET or POST
- Path to resource requested (usually a filename)
- HTTP protocol
- HTTP status code
- Time required to serve the request
See httpserver.log and the Log File Format in the web2py book.
Getting continuous updates to httpserver.log using the tail utility: OS X version
To get real-time updates to the log file, use the tail utility:
- Open a new terminal window.
- Change to the web2py root directory.
- Enter the following command line:
$ tail -f ./httpserver.log
- When you're finished, you can press Ctrl+C or just close the terminal window.
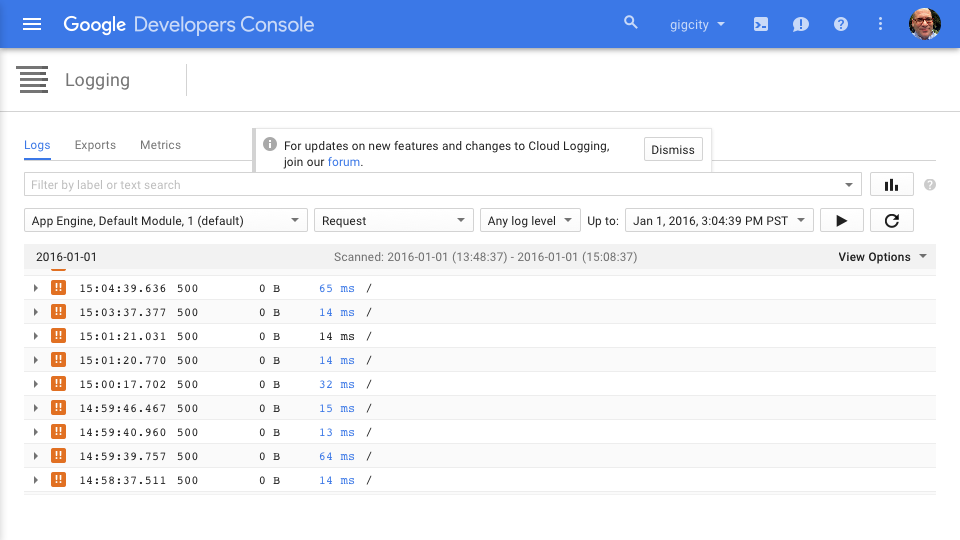
Viewing Google Developers Console logs
As App Engine serves files it logs their progress. These logs are critical diagnostic tools. Here's how to find them.
- From the main Developers Console menu, choose
LoggingunderOperations.
It looks something like this:
Viewing warning explanations
Sometimes you'll see a !! warning icon next to a resource. It means there was a problem with that resource.
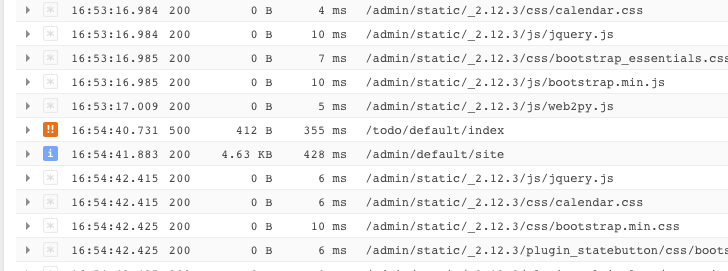
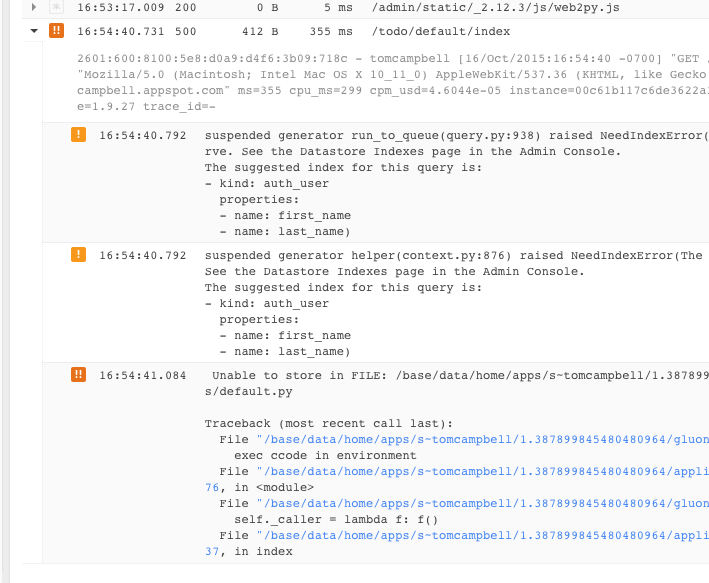
You can get details on it easily:
- Double-click the warning icon to get a complete explanation of its history
Double-checking your app.yaml file
If you see erratic database behavior, you may need to check index.yaml, an automatically generated file. Notes the web2py documentation in Deploying on Google App Engine: "It is important to always run your apps locally with the appserver and try every functionality of your app, before deployment. This will be important for testing purposes, but also to automatically generate the 'index.yaml' file. Occasionally you may want to edit this file and perform cleanup, such as removing duplicate entries"
Common error messages
Failed to load resource: the server responded with a status of 500 (Internal Server Error)
This message only appears when you are viewing the browser's console output. It probably means you do not have permission to use a file or database resource on Google App Engine. Causes might include:
- Using a GAE project that does not know your development machine's IP address, or
- An attempted connection to Google Cloud SQL database from a GAE application that has no rights to open that database